
Data-driven decisions for your painting business
Revenue, margins, lead conversion rates, close ratios, and crew performance -- all in real-time dashboards built specifically for painting companies.
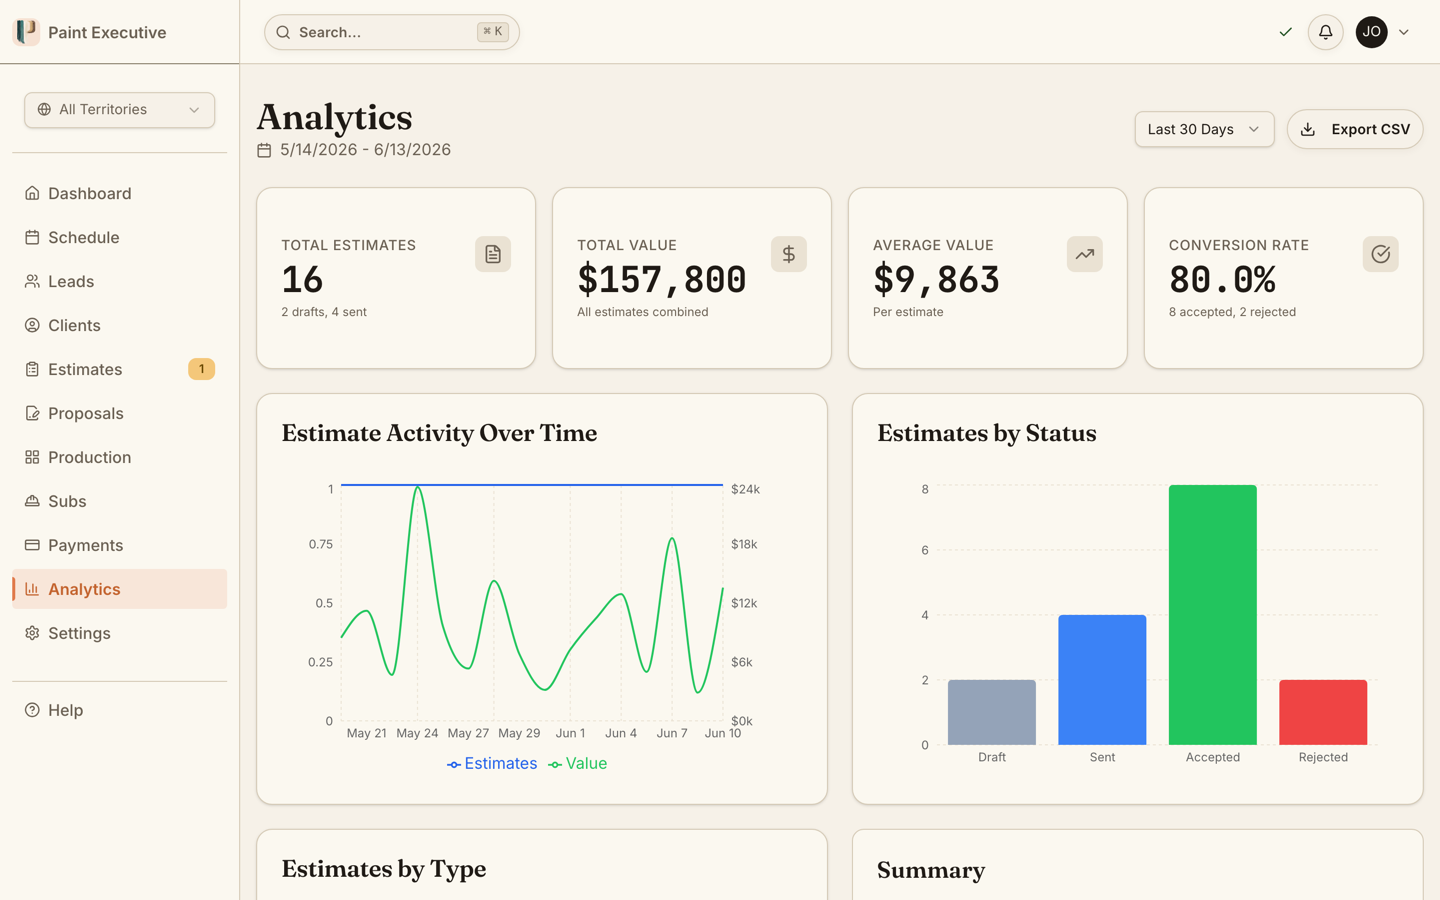
The Problem
You run your painting business on gut feeling because the data is scattered everywhere
Your revenue is in QuickBooks, your leads are in a spreadsheet, your job costs are in your head, and your crew performance is a mystery. You make decisions based on feeling, not facts.
No revenue visibility
You know you are busy, but you do not know if you are profitable. Without real-time revenue tracking, you discover margin problems months after they start.
Scattered data, no insights
Lead data is in one tool, job data in another, and financial data in a third. Cross-referencing takes hours, so you skip it and guess.
Crew performance is a mystery
Which crews finish on time? Which ones have the most callbacks? Without data, you treat all crews equally and wonder why some jobs lose money.
Capabilities
Business intelligence built for painting companies
Every metric that matters, updated in real time, in one place.
Revenue & Margin Tracking
See total revenue, gross margin, and net margin by day, week, month, or custom range. Drill into individual jobs to find margin outliers.
Lead Conversion Analytics
Track conversion rates from lead to estimate, estimate to proposal, and proposal to job. Identify where deals stall and fix the bottleneck.
Crew Performance Metrics
Compare crews by on-time completion rate, average job duration, customer satisfaction, and callback frequency. Use data to assign your best crews to your biggest jobs.
Close Rate Dashboard
See your close rate by estimator, lead source, job type, and territory. Know who and what converts best so you can double down.
Pipeline Visibility
See open proposals and scheduled work across your pipeline. Plan capacity, materials, and sub assignments weeks ahead.
Custom Report Builder
Filter any metric by date, territory, job type, crew, or source. Export to CSV for further analysis or share dashboards with your team.
How It Works
From raw data to actionable insight in four steps
Collect
Every lead, estimate, proposal, job, and invoice feeds data into the analytics engine automatically.
Visualize
Dashboards surface the metrics that matter: revenue, margins, conversion rates, and crew performance.
Identify
Spot trends, outliers, and bottlenecks. Drill into any metric to find the root cause.
Act
Make decisions based on data. Adjust pricing, reassign crews, double down on top lead sources.
Collect
Every lead, estimate, proposal, job, and invoice feeds data into the analytics engine automatically.
Visualize
Dashboards surface the metrics that matter: revenue, margins, conversion rates, and crew performance.
Identify
Spot trends, outliers, and bottlenecks. Drill into any metric to find the root cause.
Act
Make decisions based on data. Adjust pricing, reassign crews, double down on top lead sources.
Stop guessing, start knowing
Real-time analytics built for painting companies. Revenue, margins, conversion rates, and crew performance. Try it free for 14 days.
A Closer Look
See analytics in action
Real product screens showing the analytics dashboards and reports.
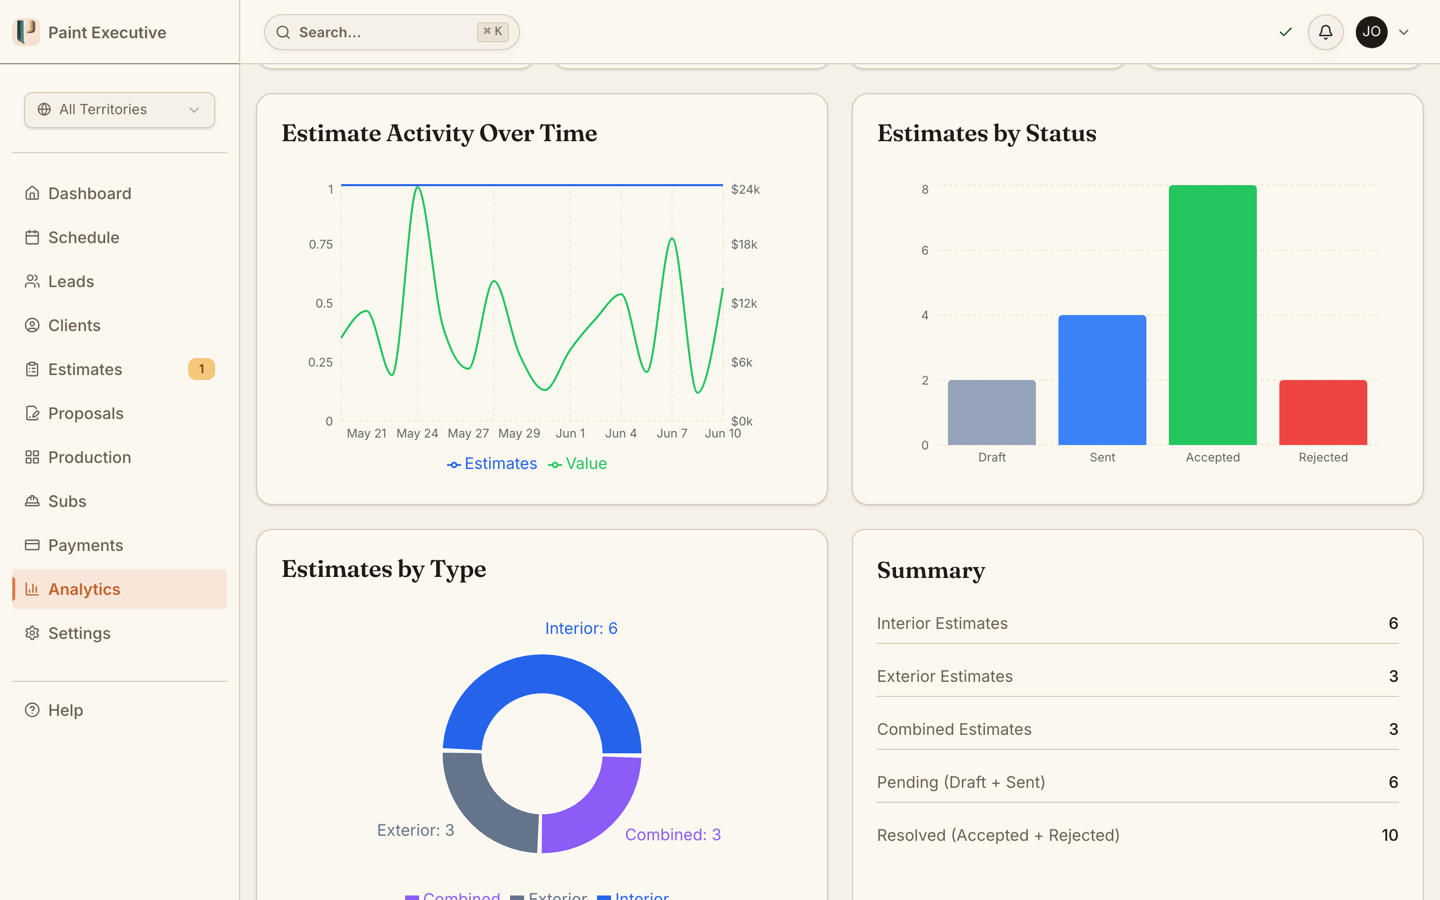
Estimate activity and status at a glance
Track estimate volume and value over time, and see how your estimates break down by status — draft, sent, accepted, and rejected — across any date range.
Estimate count and value trended over time
Status breakdown: draft, sent, accepted, rejected
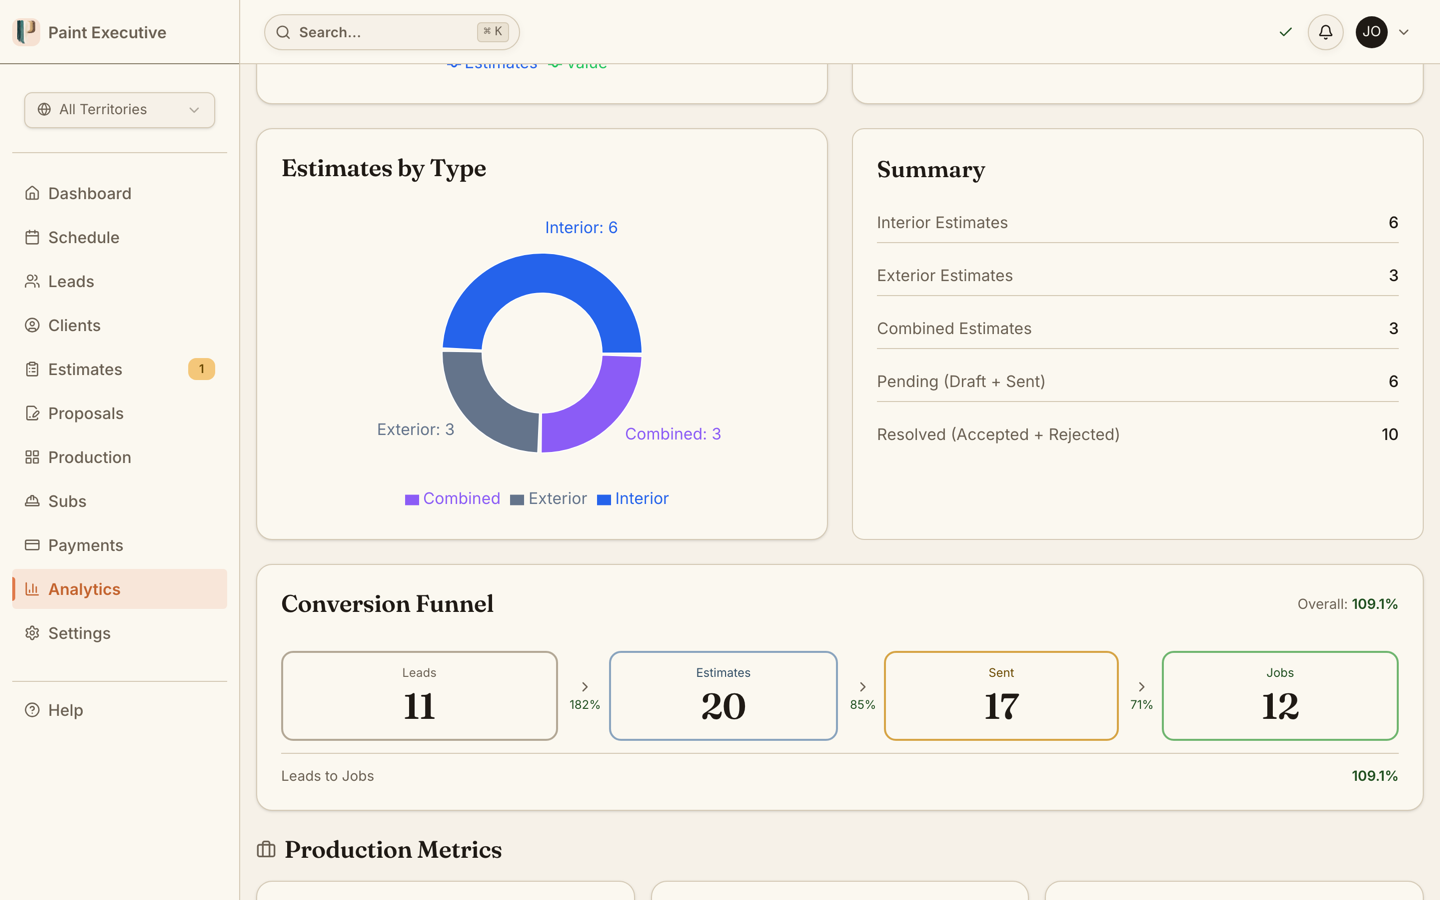
Conversion funnel and estimate mix
See your lead-to-job conversion funnel alongside the mix of interior, exterior, and combined work, with pending versus resolved counts summarized in one place.
Lead → estimate → sent → job funnel
Estimate mix by job type with summary totals
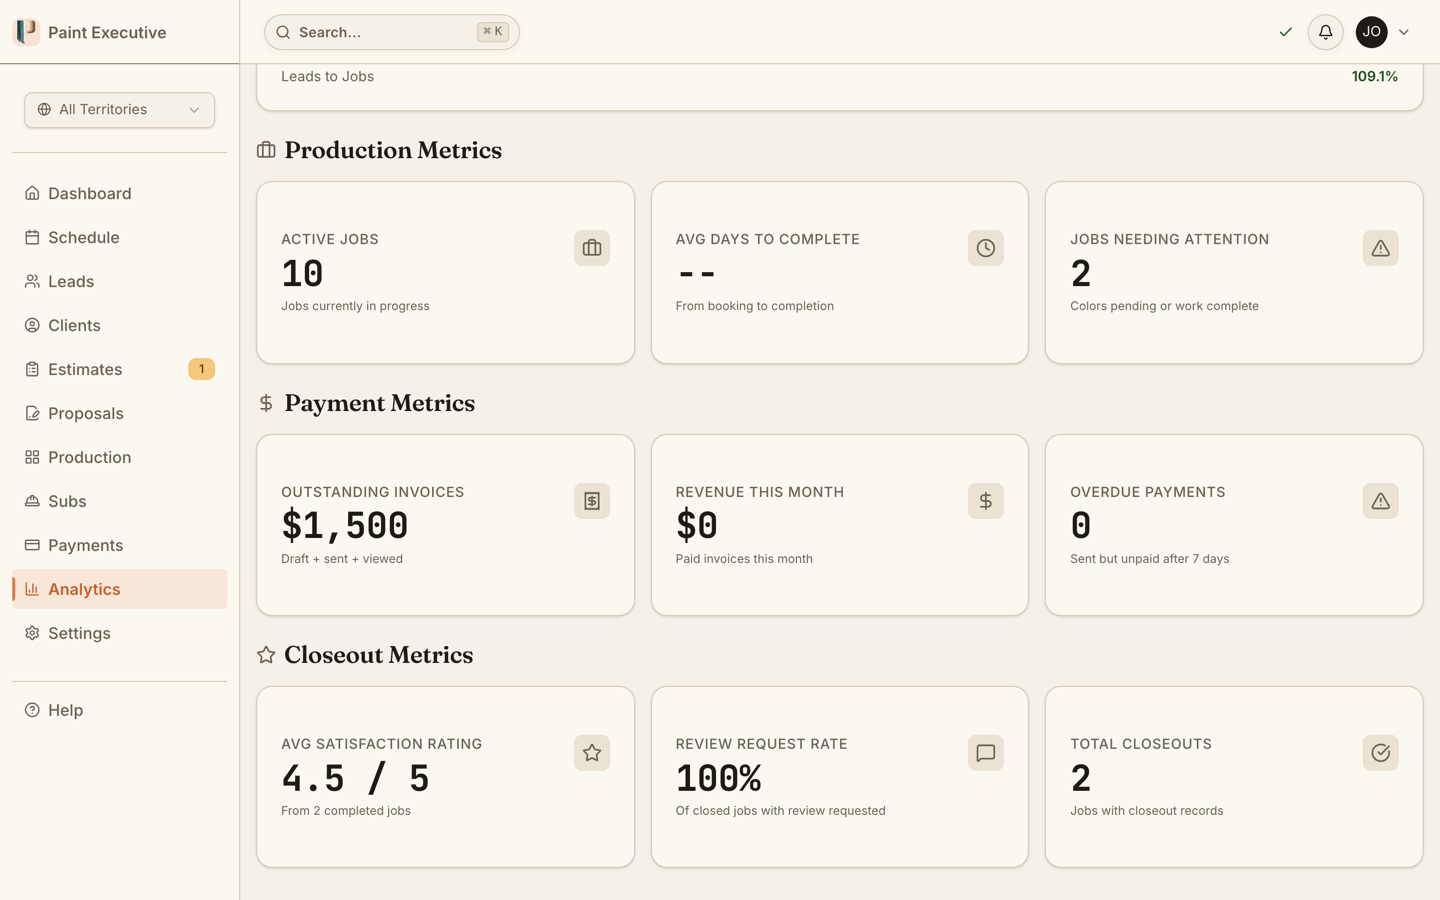
Production, payment, and closeout metrics
Go beyond estimates with operational metrics — active jobs and jobs needing attention, outstanding and overdue invoices, and closeout satisfaction ratings — all in one view.
Active jobs, outstanding invoices, overdue payments
Closeout satisfaction and review request rates
FAQ
Common questions about analytics
Yes. Dashboards pull from the same database that powers the rest of the platform. When a job status changes, a payment is collected, or a lead converts, the analytics reflect it immediately.
Yes. Any dashboard view can be exported to CSV for further analysis in Excel or Google Sheets.
Yes. All dashboards support daily, weekly, monthly, quarterly, and custom date range filtering. You can compare periods side by side to spot trends.
Yes. Every Paint Executive plan includes the full analytics suite — revenue and margin, conversion funnels, crew performance, and exportable reports. There are no feature tiers; every company gets everything.
Admins and owners see all analytics. Estimators see their own performance metrics (close rate, average estimate value). Subcontractors see only their earnings data through the sub portal.
Related Features
Analytics is just the beginning
Ready to run your painting business on data?
Join painting companies that make decisions based on facts, not feelings. Start your free 14-day trial today.